
2.2.1To exist or not to exist?
Introduction to Limits as Predictions
FOR SALE, Part One
Jacinda has a 1988 Rustang that she wants to sell. Travis is interested in buying her car, but they have not decided on a price. Travis offers
Taking on the challenge, Travis agrees to look at similar Rustangs in the classified section of the newspaper. Below are all the Rustangs that Travis finds advertised.

Year | 1978 | 1980 | 1981 | 1983 | 1984 | 1986 |
Asking Price |
From the data, can you make a prediction about the asking price for a 1988 Rustang? How reliable is this prediction?
Jacinda decides to do her own investigation using a local paper. Below is her data. According to her research, what price do you predict for a 1988 Rustang?
Year
1990
1991
1993
1994
1996
Asking Price
Based on this information, will Travis and Jacinda agree on the price?
Jacinda and Travis decide that additional research is necessary. They grab another paper and find a 1987 Rustang for sale for
and a 1989 Rustang for sale for . Will this new information help them to make a decision about the fair price of the car?
FOR SALE, Part Two
By trying to predict the price for the 1988 Rustang, we are seeking a “limit,” or a final prediction of the price as the year approaches 1988. This can be written:
The left-hand limit is read “As the year approaches 1988 from the left, the asking price approaches
Translate the right-hand limit into a sentence.
uses both sides of 1988 to estimate a value.
Sincewe state that the does not exist because the two sides do not agree.
What must be true about the left- and right-hand limits for theto exist?
STICKY LIMITS
Holly is trying to predict the value of
Since a limit is a prediction based on a pattern of

An Intuitive Definition of Limit
When you graph a function
For example, if
You can also take one-sided limits using numbers less than
An important point is that
Express the following limit statements as approach statements using complete sentences. Then draw graphs that can represent each limit.
Without a calculator, sketch
Write a complete set of approach statements for this function. Include
. Approach statements describe what
is approaching as approaches some value. This is the same as a limit. For example, one approach statement for can be rewritten using limits as: Use your approach statement from part (a) to rewrite
and as limit statements.

Determine if each of the following conjectures is always true, sometimes true, or never true. Then provide examples and/or counterexamples to support your claim.
Conjecture 1: When a limit exists at a certain
Conjecture 2: If a function is defined at a certain

Translate the following limit equations using a complete sentence. Then draw a graph to represent each situation. Homework Help ✎
(a soda’s temperature) room temperature
Consider the functions
What is the domain of each function?
Graph
on your graphing calculator. Explain why
is not continuous at . What is the range of each function?
Sketch a graph of each of the functions below. Compare the equations and their graphs. Then write a complete set of approach statements for each. Homework Help ✎
Explain why one graph has a hole while the other has a vertical asymptote.
What is the end behavior of each function?
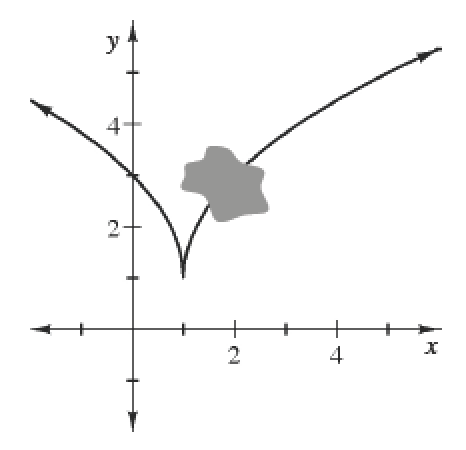
Write as many limit statements as you can about the function graphed at right as
.png)
Write the equation of the line that passes through the vertex of
If
For
Estimate the area using these rectangles.
If the shaded region is rotated about the x-axis, then each of these rectangles becomes what shape? Sketch a picture representing this situation.
Estimate the volume of this rotated region by calculating the volume of each of the rotated rectangles.
.png)
Zuhaib is anxiously waiting for the results of his calculus test and is pacing back and forth as shown in the graph below. Homework Help ✎
.png)
At which point
is Zuhaib’s speed the greatest? Approximate the rate. At which point is Zuhaib’s velocity the greatest? Approximate the rate.
What is the difference between speed and velocity?